
The feature called Profiler which plays an important role with
Magento development and can be used for developer only to debugging. It
specifies blocks of code which makes loading of the page slow. The
Magento profiler reports the time taken by block of code to execute,
number of times the block of the code executed and memory used by it
while rendering a Magento web page.
To enable the Profiler, you have to do the following things:
Step (1): Login to your Magento Admin Panel.
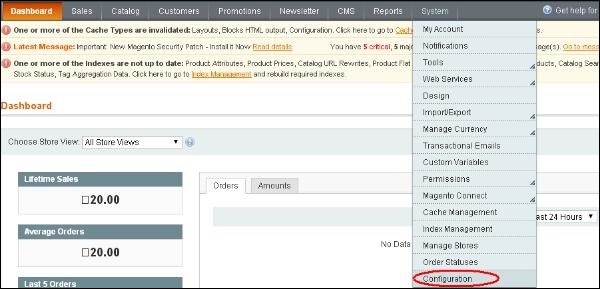
Step (2): Go to System menu and click on the Configuration option.
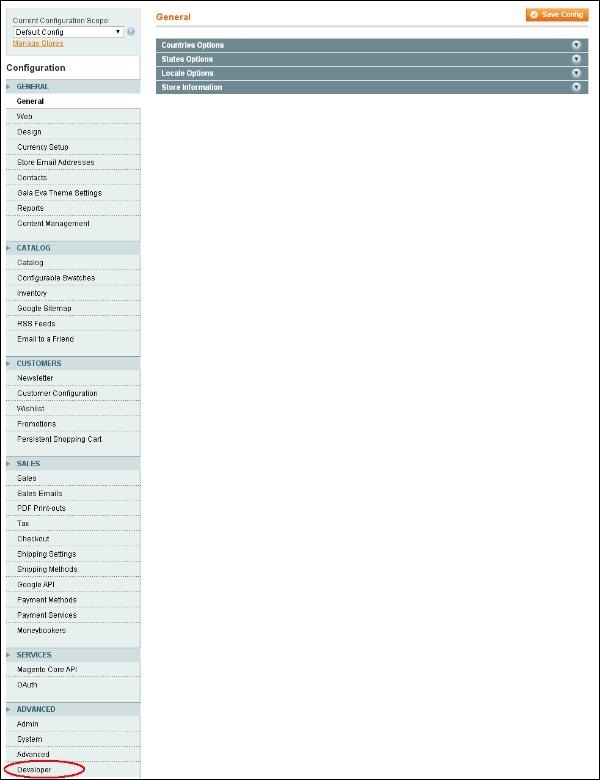
 Step (3): On the left side of the navigation, go to Advanced section and click on the Developer option.
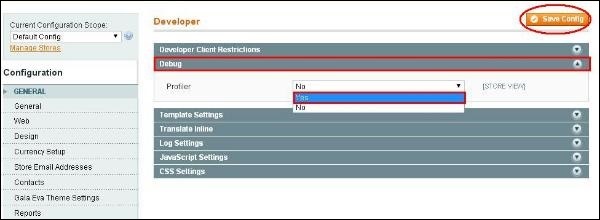
 Step (4): Expand the Debug panel and enable the profiler by setting it to option Yes and click on the Save Config button.
 Step (5): At this point the profiler is enabled, but we need
to tell the profiler to what profile. So go to root index.php file of
your Magento installation and look for the line #Varien_Profiler::enable(); and uncomment it i.e. remove the hash sign.
Step (5): At this point the profiler is enabled, but we need
to tell the profiler to what profile. So go to root index.php file of
your Magento installation and look for the line #Varien_Profiler::enable(); and uncomment it i.e. remove the hash sign.
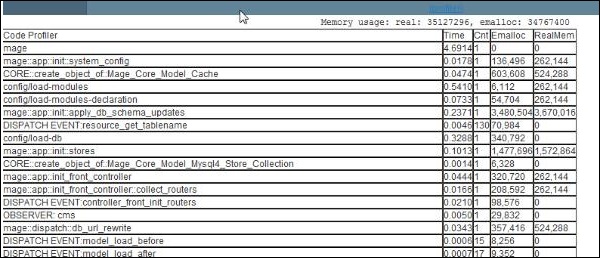
Step (6): Now go to any of your pages, you should see the output in the footer area of the page like shown in the screen below.
To enable the Profiler, you have to do the following things:
Step (1): Login to your Magento Admin Panel.
Step (2): Go to System menu and click on the Configuration option.
Step (3): On the left side of the navigation, go to Advanced section and click on the Developer option.
Step (4): Expand the Debug panel and enable the profiler by setting it to option Yes and click on the Save Config button.
Step (5): At this point the profiler is enabled, but we need
to tell the profiler to what profile. So go to root index.php file of
your Magento installation and look for the line #Varien_Profiler::enable(); and uncomment it i.e. remove the hash sign.Step (6): Now go to any of your pages, you should see the output in the footer area of the page like shown in the screen below.
No comments:
Post a Comment