Debugging & logging information is very necessary while
developing the themes and plugins. Grav uses debugging information by
using some features as described below.
PHP Debug Bar
Grav comes with tool called
Debug Bar to display debugging information. By default this feature is disabled. You can turn it on globally or using
system.yaml for your development environment.
debugger:
  enabled: true
  twig: true
  shutdown:
    close_connection: true
After enabling debugger true, you can view the following debug bar as
shown below. Click on the G symbol which is present at the left side of
the corner.
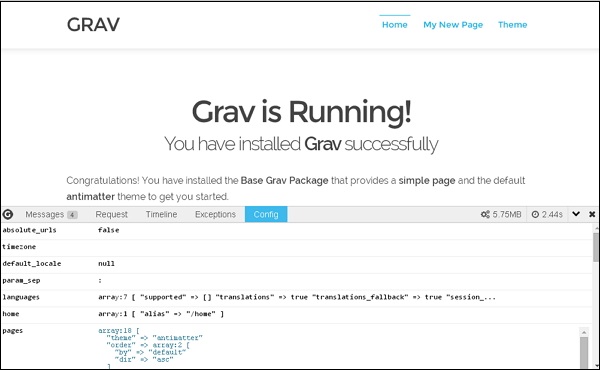
In the debug bar, you can view the overall memory usage and time used
for processing at the right side corner. It also consist several tabs
that provides more information in detail.
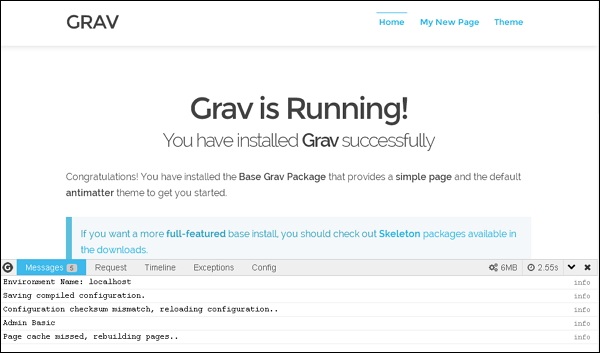
In the Messages tab, you can view the messages which will help you to
debug your Grav development process and the information will get post
to this tab from the code via
$grav['debugger']->addMessage($my_var).
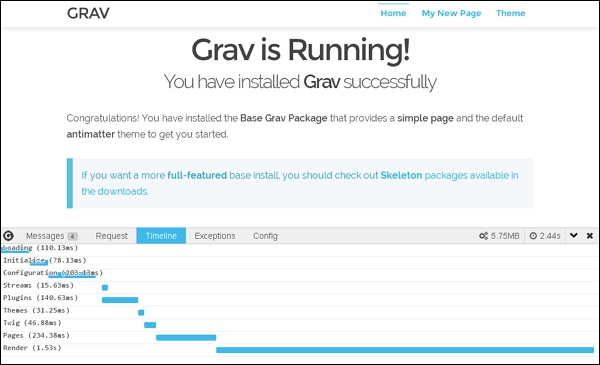
In Timeline tab you can view the breakdown of Grav timing.
Error Display
It displays error messages regarding the block or page at a runtime.
In Grav you can easily identify the error and resolve the errors very
quickly. Following are the error messages that will get displayed on
your screen as shown below.
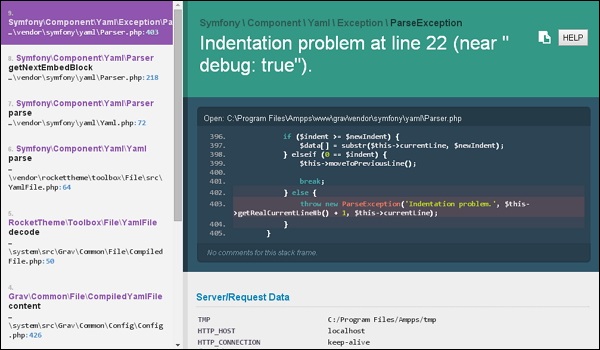
In
user/config/system.yaml file, you can disable the error page by setting it to false.
errors:
  display: false
  log: true
Logging
Logging is used for reporting errors and status information from
libraries and application. In Grav there are few important logging
features as specified below.
$grav['log']->info('My informational message');
$grav['log']->notice('My notice message');
$grav['log']->debug('My debug message');
$grav['log']->warning('My warning message');
$grav['log']->error('My error message');
$grav['log']->critical('My critical message');
$grav['log']->alert('My alert message');
$grav['log']->emergency('Emergency, emergency, there is an emergency here!');
All logging messages will get displayed in the
grav.log file which is present under the folder
<your_folder_name>/logs/grav.log
 In the debug bar, you can view the overall memory usage and time used
for processing at the right side corner. It also consist several tabs
that provides more information in detail.
 In the Messages tab, you can view the messages which will help you to
debug your Grav development process and the information will get post
to this tab from the code via $grav['debugger']->addMessage($my_var).
  In Timeline tab you can view the breakdown of Grav timing.
 In user/config/system.yaml file, you can disable the error page by setting it to false.
No comments:
Post a Comment