
This chapter explains the concept of breakpoints and how to set
breakpoints in a program. A breakpoint introduces an explicit stop or
pause in the execution of a program at a particular line of code while
debugging. It is useful to acquire knowledge about variables in the
program in its execution.
 The execution stops at the first line of the main method, that is at
"int a=5, b=6;" or Line no: 11 in the code. You can observe this
information in the output.
The execution stops at the first line of the main method, that is at
"int a=5, b=6;" or Line no: 11 in the code. You can observe this
information in the output.
Syntax
The following command sets up a breakpoint at a particular line number:> stop at <class name>:<Line no>The following command sets up a breakpoint on a particular method or on a particular variable:
> stop in <class name>:< Method name | Variable name>
Example
The following example shows how to set up a breakpoint in a class.public class Add { public int addition( int x, int y) { int z = x + y; return z; } public static void main( String ar[ ] ) { int a = 5, b = 6; Add ob = new Add(); int c = ob.addition(a,b); System.out.println("Add: " + c); } }Save the above file as Add.java. Compile this file using the following command:
\>javac Add.java
Debugging
Let us take an example for debugging. Here, we start the debugging process by setting up a breakpoint on main(). Given below are the steps to be followed in the debugging process:Step 1: Start a JDB Session
The following command starts a JDB session on the Add class for debugging:\> jdb Add
Step 2: Set a Breakpoint
The following command sets up a breakpoint on the main() method of Add class.> stop in Add.mainIf the breakpoint is set successfully, you get to see the following output:
Deferring breakpoint Add.main.
It will set after the class is loaded.
>
Step 3: Start Debugging
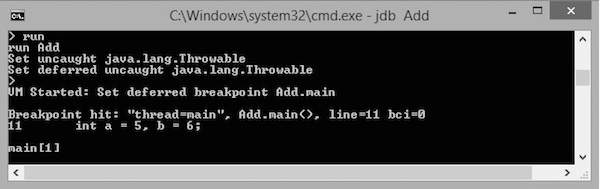
The following command starts execution of the class Add:> run AddIf you run this command, you get to see the following output. In this output, you find that the execution stops at the breakpoint position, that is at the main() function.
The execution stops at the first line of the main method, that is at
"int a=5, b=6;" or Line no: 11 in the code. You can observe this
information in the output.Step 4: Continue Execution
The following command continues the program execution:cont
It gives you the remaining execution part and output as follows:> Add:11 The application exited \>
No comments:
Post a Comment