
Setting Benchmark Points
If you want to measure the time taken to execute a set of lines or memory usage, you can calculate it by using Benchmarking points in CodeIgniter. There is a separate “Benchmarking” class for this purpose in CodeIgniter.This class is loaded automatically; you do not have to load it. It can be used anywhere in your controller, view, and model classes. All you have to do is to mark a start point and end point and then execute the elapsed_time() function between these two marked points and you can get the time it took to execute that code as shown below.
<?php
   $this->benchmark->mark('code_start');

   // Some code happens here

   $this->benchmark->mark('code_end');

   echo $this->benchmark->elapsed_time('code_start', 'code_end');
?>
To display the memory usage, use the function memory_usage() as shown in the following code.
<?php
   echo $this->benchmark->memory_usage();
?>
Example
Create a controller called Profiler_controller.php and save it in application/controller/Profiler_controller.php<?php class Profiler_controller extends CI_Controller { public function index() { //enable profiler $this->output->enable_profiler(TRUE); $this->load->view('test'); } public function disable() { //disable profiler $this->output->enable_profiler(FALSE); $this->load->view('test'); } } ?>Create a view file called test.php and save it at application/views/test.php
<!DOCTYPE html>
<html lang = "en">

   <head>
      <meta charset = "utf-8">
      <title>CodeIgniter View Example</title>
   </head>

   <body>
      CodeIgniter View Example
   </body>

</html>
Change the routes.php file at application/config/routes.php to add route for the above controller and add the following line at the end of the file.
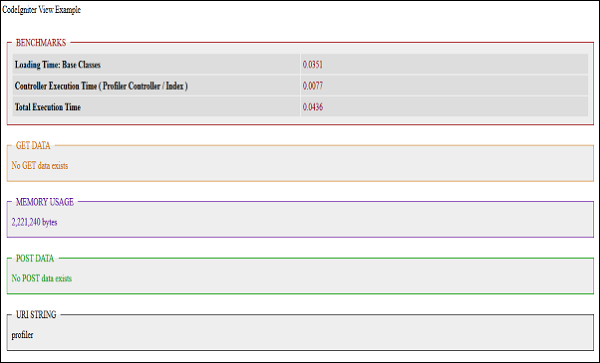
$route['profiler'] = "Profiler_controller";
$route['profiler/disable'] = "Profiler_controller/disable"
After that, you can type the following URL in the address bar of your browser to execute the example.
http://yoursite.com/index.php/profilerThe above URL will enable the profiler and it will produce an output as shown in the following screenshot.
 To disable the profiling, execute the following URL.
http://yoursite.com/index.php/profiler/disable
No comments:
Post a Comment