
In this chapter, we will discuss about the cPanel statistics and the
dashboard along with a few examples and screenshots for better
understanding.
 General − It will show you the amount of bandwidth allotted to
your account and also the amount of bandwidth, which is used by you. It
will also show you the FTP accounts available in your cPanel account.
It will also show the information of your Home directory and the IP
address, from which you logged in last time. You can click on the Server
Information to view the detailed information of your server.
General − It will show you the amount of bandwidth allotted to
your account and also the amount of bandwidth, which is used by you. It
will also show you the FTP accounts available in your cPanel account.
It will also show the information of your Home directory and the IP
address, from which you logged in last time. You can click on the Server
Information to view the detailed information of your server.
Domain Info − In the next box, it will show you the information of main domain and the number of add-on domains, subdomains and aliases you have created.
Mail Info − This section will show the information about your emails. It will tell you how many email accounts, Autoresponder Forwarders and Filters you have created along with the total number of resource allotted.
Disk Space − In this section, the total disk space of your account is shown and also the amount of space used by MySQL database is shown along with total amount of space allotted to your account and MySQL database.
Database − This section shows the info of total number of databases you have created along with the total number of database you can create.
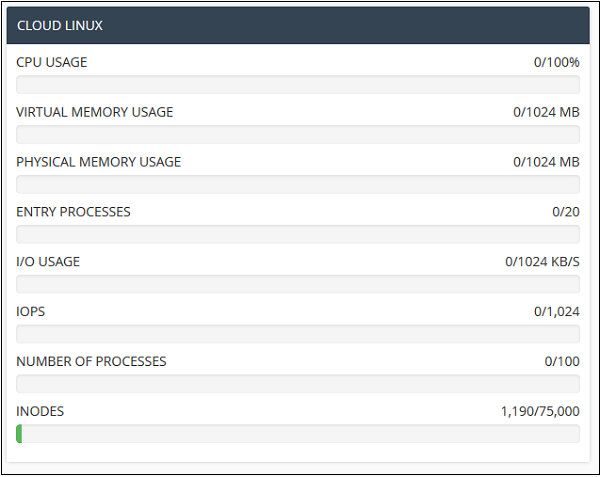 System Information − In this section, the statistics cPanel
shows you the information of your system with total CPU usage, virtual
and physical memory that is being used. It also displays information of
the process you are running, the Input and Output uses and also it
displays number of inodes, which means the number of files.
System Information − In this section, the statistics cPanel
shows you the information of your system with total CPU usage, virtual
and physical memory that is being used. It also displays information of
the process you are running, the Input and Output uses and also it
displays number of inodes, which means the number of files.
cPanel Statistics
The statistics interface of cPanel shows quick statistics of your cPanel account. It includes several types of information shown below. To view quick statistics of your cPanel account, click on second icon statistics from sidebar at left. You will find this information in cPanel quick statistics.
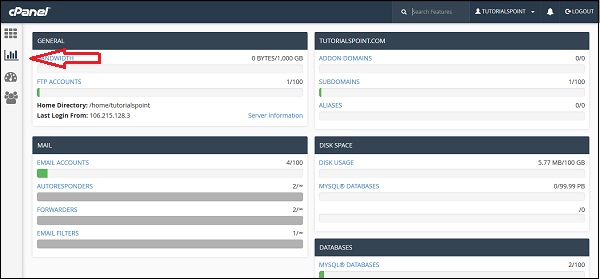
General − It will show you the amount of bandwidth allotted to
your account and also the amount of bandwidth, which is used by you. It
will also show you the FTP accounts available in your cPanel account.
It will also show the information of your Home directory and the IP
address, from which you logged in last time. You can click on the Server
Information to view the detailed information of your server.Domain Info − In the next box, it will show you the information of main domain and the number of add-on domains, subdomains and aliases you have created.
Mail Info − This section will show the information about your emails. It will tell you how many email accounts, Autoresponder Forwarders and Filters you have created along with the total number of resource allotted.
Disk Space − In this section, the total disk space of your account is shown and also the amount of space used by MySQL database is shown along with total amount of space allotted to your account and MySQL database.
Database − This section shows the info of total number of databases you have created along with the total number of database you can create.
System Information − In this section, the statistics cPanel
shows you the information of your system with total CPU usage, virtual
and physical memory that is being used. It also displays information of
the process you are running, the Input and Output uses and also it
displays number of inodes, which means the number of files.cPanel Dashboard
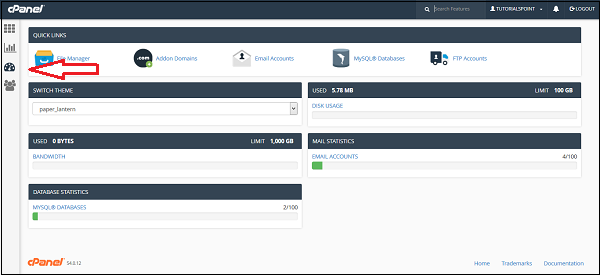
Through this interface you can see some brief statistics of your cPanel account plus you can change the theme of your cPanel account. To access your dashboard, you can click on the third icon ‘Dashboard’ on the left sidebar.
No comments:
Post a Comment