
Debugging is a technical procedure to find and remove bugs or defects
in a program and get expected results. Debugging includes testing and
monitoring. It is very complex when the subunits of a program are
tightly coupled.
We can debug a program using the debugger tools that follow the prescribed APIs. A debugger allows you to step through every aspect of a code, inspect all the elements, and remove errors, if any.
In addition, we have advanced concepts that can be used to debug a program such as:
We can debug a program using the debugger tools that follow the prescribed APIs. A debugger allows you to step through every aspect of a code, inspect all the elements, and remove errors, if any.
Debugging Techniques
There are different kinds of techniques to debug a Java program. The old method of debugging is by using print statements at the end of every segment which will print the trace statements on the console. Take a look at the following code.pubic class Add { public static void main(String ar[]) { int a = ar[0]; system.out.println("A : " + a); int b = ar[1]; system.out.println("B : " + b); int c = a + b; system.out.println("C = a + b : " + c); } }Here, we have a program that adds two numbers and prints the output. Notice that at each step, we have introduced a print statement that prints the state of the program on the console. This is the traditional approach to debug a program.
In addition, we have advanced concepts that can be used to debug a program such as:
- stepping
- breakpoints, and
- exceptions or watchpoints.
Types of Debugging
We can debug a program using various methods:- Using Java bytecode (compiled version of Java code)
- Using comments inside the programs
- Attaching class to a running program
- Remote debugging
- Debugging on demand
- Optimized code debugging
Java Debuggers
Here are some examples of Java debuggers that are available in the market:- IDEs such as Eclipse, Netbeans, etc. contain their own debuggers (Visual cafe, Borland, JBuilder)
- Standalone debugger GUIs (such as Jikes, Java platform debugger, and JProbe)
- Command-line debugger (Sun’s JDB)
- Notepad or VI driven (stack trace)
JDB
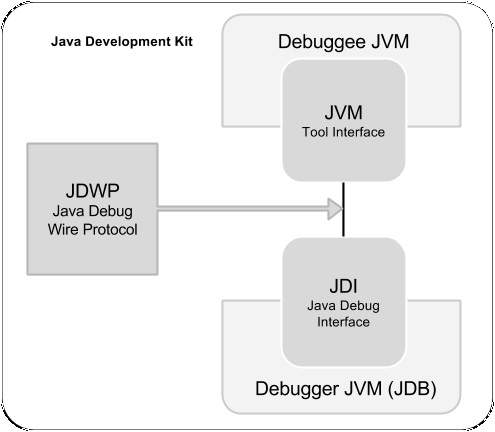
The Java debugger (JDB) is a tool for Java classes to debug a program in command line. It implements the Java Platform Debugger Architecture. It helps in detecting and fixing bugs in a Java program using Java Debug Interface (JDI).JDB in JDK
The following architecture defines the role of JDB in JDK. It contains mainly three units:- Java Virtual Machine Tool Interface (JVM TI)
- Java Debug Wiring Pool (JDWP)
- Java Debugger Interface (JDI)
No comments:
Post a Comment