Flex provides excellent capability of debugging flex code and Flash
Builder 4 has an excellent built-in debugger and debugging perspective
support.
- During debug mode, Flex Application runs on Flash Player Debugger
version built in Flash Builder 4 which supports debugging capability.
- So developers get an easy and inbuilt debugging configuration in Flash Builder
In this article we'll demonstrate usage of debugging Flex Client code using Flash Builder. We'll do the following tasks
- Set break points in the code and see them in BreakPoint Explorer.
- Step through the code line by line during debugging.
- View the values of variable.
- Inspect the values of all the variables.
- Inspect the value of an expression.
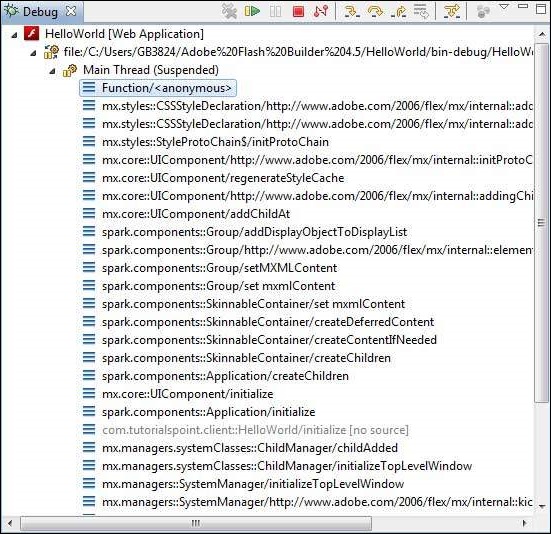
- Display the stack frame for suspended threads.
Debugging Example
| Step | Description |
|---|
| 1 | Create a project with a name HelloWorld under a package com.tutorialspoint.client as explained in the Flex - Create Application chapter. |
| 2 | Modify HelloWorld.mxml as explained below. Keep rest of the files unchanged. |
| 3 | Compile and run the application to make sure business logic is working as per the requirements. |
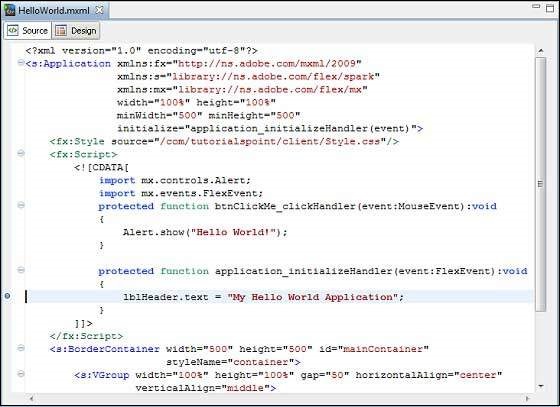
Following is the content of the modified mxml file
src/com.tutorialspoint/HelloWorld.mxml.
<?xml version="1.0" encoding="utf-8"?>
<s:Application xmlns:fx="http://ns.adobe.com/mxml/2009"
   xmlns:s="library://ns.adobe.com/flex/spark"
   xmlns:mx="library://ns.adobe.com/flex/mx"
   width="100%" height="100%"
   minWidth="500" minHeight="500"
   initialize="application_initializeHandler(event)">
   <fx:Style source="/com/tutorialspoint/client/Style.css"/>
   <fx:Script>
      <![CDATA[
       import mx.controls.Alert;
       import mx.events.FlexEvent;
       protected function btnClickMe_clickHandler(event:MouseEvent):void
       {
          Alert.show("Hello World!");
       }

       protected function application_initializeHandler(event:FlexEvent):void
       {
          lblHeader.text = "My Hello World Application";
       }
      ]]>
   </fx:Script>
   <s:BorderContainer width="500" height="500" id="mainContainer"
      styleName="container">
      <s:VGroup width="100%" height="100%" gap="50" horizontalAlign="center"
         verticalAlign="middle">
         <s:Label id="lblHeader" fontSize="40" color="0x777777"
            styleName="heading"/>
         <s:Button label="Click Me!" id="btnClickMe"
            click="btnClickMe_clickHandler(event)" styleName="button" />
      </s:VGroup>
   </s:BorderContainer>
</s:Application>
Once you are ready with all the changes done, let us compile in normal mode as we did in
Flex - Create Application chapter.
Step 1 - Place BreakPoints
Place a breakpoint on the first line of application_initializeHandler of HelloWorld.mxml
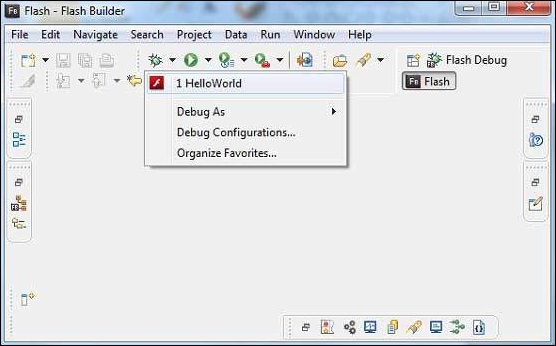
Step 2 - Debug Application
Now click on

Debug application menu and select
HelloWorld application to debug the application.
If everything is fine, application will launch in the browser and you will see following debug logs in Flash Builder console
[SWF] \HelloWorld\bin-debug\HelloWorld.swf
- 181,509 bytes after decompression
[SWF] \HelloWorld\bin-debug\HelloWorld.swf\[[DYNAMIC]]\1
- 763,122 bytes after decompression
[SWF] \HelloWorld\bin-debug\HelloWorld.swf\[[DYNAMIC]]\2
- 1,221,837 bytes after decompression
[SWF] \HelloWorld\bin-debug\HelloWorld.swf\[[DYNAMIC]]\3
- 1,136,788 bytes after decompression
[SWF] \HelloWorld\bin-debug\HelloWorld.swf\[[DYNAMIC]]\4
- 2,019,570 bytes after decompression
[SWF] \HelloWorld\bin-debug\HelloWorld.swf\[[DYNAMIC]]\5
- 318,334 bytes after decompression
As soon as Application launches,you will see the focus on Flash
Builder breakpoint as we've placed the breakpoint on first line of
application_initializeHandler method.
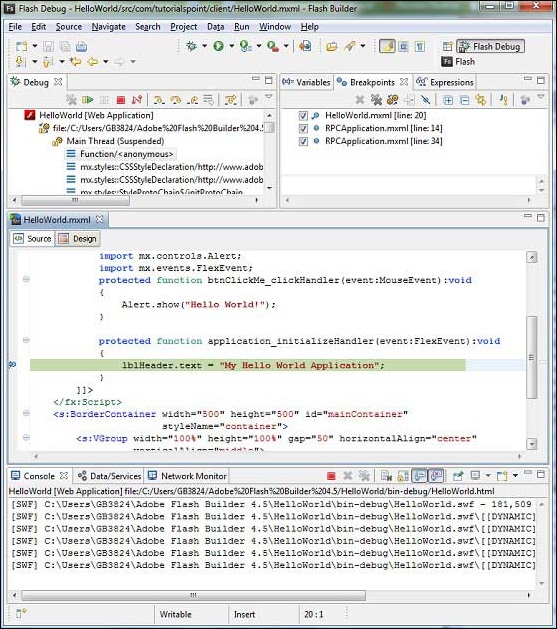
You can see the stacktrace for suspended threads.
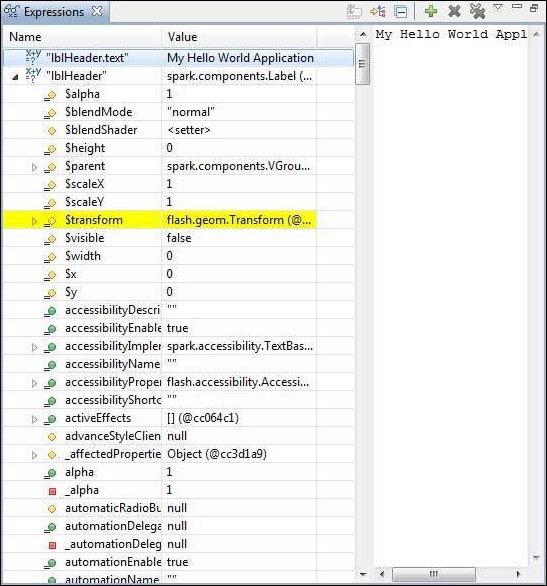
You can see the values for expressions.
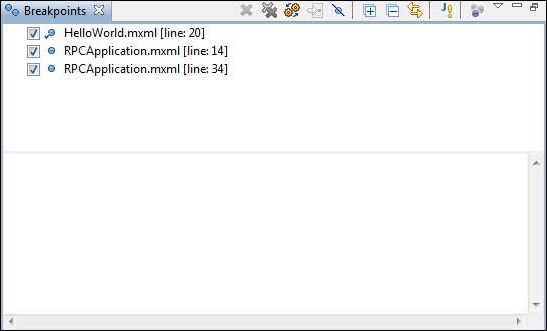
You can see the list of breakpoints placed.
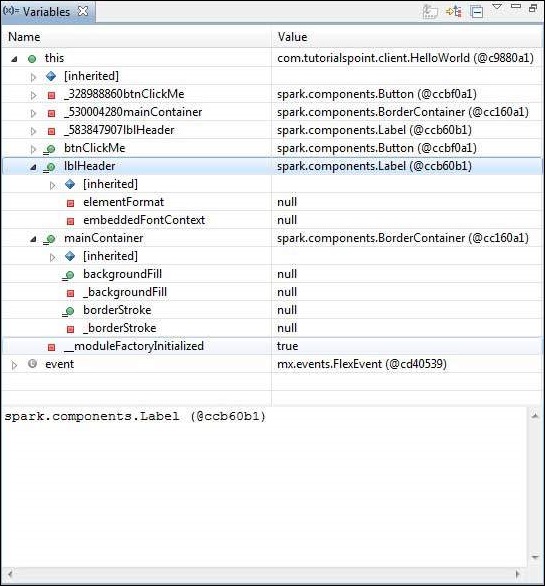
Now keep pressing F6 until you reach the last line of
application_initializeHandler() method. As reference for function keys,
F6 inspects code line by line, F5 steps inside further and F8 will
resume the application. Now you can see the list of values of all
variables of application_initializeHandler() method.
Now you can see the flex code can be debugged in the same way as a
Java Application can be debugged. Place breakpoints to any line and play
with debugging capabilities of flex.

No comments:
Post a Comment