
This example shows you how to read an analog input at analog pin 0,
convert the values from analogRead() into voltage, and print it out to
the serial monitor of the Arduino Software (IDE).
 These 10-segment bar graph LEDs have many uses. With a compact
footprint, simple hookup, they are easy for prototype or finished
products. Essentially, they are 10 individual blue LEDs housed together,
each with an individual anode and cathode connection.
These 10-segment bar graph LEDs have many uses. With a compact
footprint, simple hookup, they are easy for prototype or finished
products. Essentially, they are 10 individual blue LEDs housed together,
each with an individual anode and cathode connection.
They are also available in yellow, red, and green colors.
Note − The pin out on these bar graphs may vary from what is listed on the datasheet. Rotating the device 180 degrees will correct the change, making pin 11 the first pin in line.
Components Required
You will need the following components −- 1 × Breadboard
- 1 × Arduino Uno R3
- 1 × 5k ohm variable resistor (potentiometer)
- 2 × Jumper
- 8 × LED or you can use (LED bar graph display as shown in the image below)
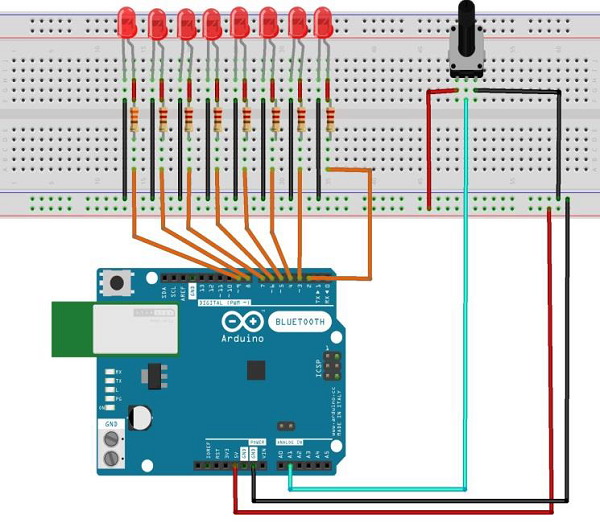
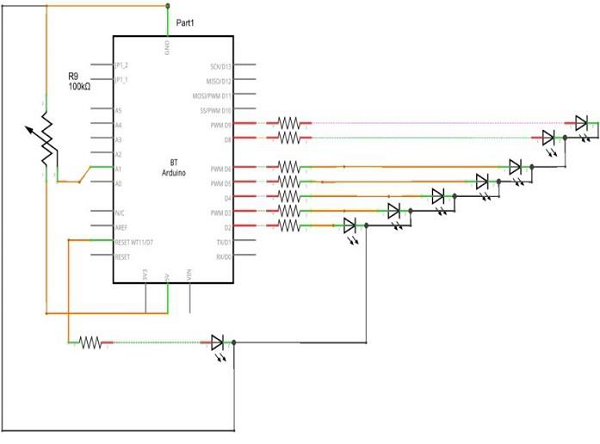
Procedure
Follow the circuit diagram and hook up the components on the breadboard as shown in the image given below.
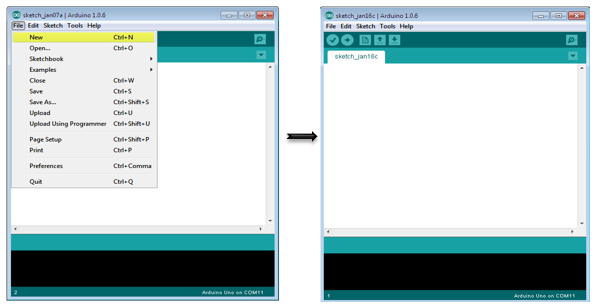
Sketch
Open the Arduino IDE software on your computer. Coding in the Arduino language will control your circuit. Open a new sketch File by clicking New.
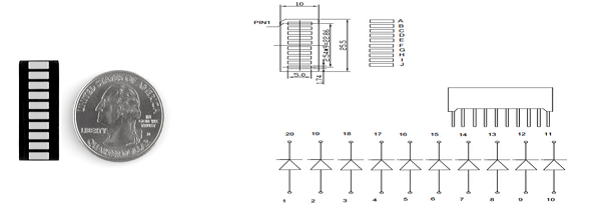
10 Segment LED Bar Graph
These 10-segment bar graph LEDs have many uses. With a compact
footprint, simple hookup, they are easy for prototype or finished
products. Essentially, they are 10 individual blue LEDs housed together,
each with an individual anode and cathode connection.They are also available in yellow, red, and green colors.
Note − The pin out on these bar graphs may vary from what is listed on the datasheet. Rotating the device 180 degrees will correct the change, making pin 11 the first pin in line.
Arduino Code
/*
   LED bar graph
   Turns on a series of LEDs based on the value of an analog sensor.
   This is a simple way to make a bar graph display.
   Though this graph uses 8LEDs, you can use any number by
      changing the LED count and the pins in the array.
   This method can be used to control any series of digital
      outputs that depends on an analog input.
*/

// these constants won't change:
const int analogPin = A0; // the pin that the potentiometer is attached to
const int ledCount = 8; // the number of LEDs in the bar graph
int ledPins[] = {2, 3, 4, 5, 6, 7, 8, 9}; // an array of pin numbers to which LEDs are attached

void setup() {
   // loop over the pin array and set them all to output:
   for (int thisLed = 0; thisLed < ledCount; thisLed++) {
      pinMode(ledPins[thisLed], OUTPUT);
   }
}

void loop() {
   // read the potentiometer:
   int sensorReading = analogRead(analogPin);
   // map the result to a range from 0 to the number of LEDs:
   int ledLevel = map(sensorReading, 0, 1023, 0, ledCount);
   // loop over the LED array:
   for (int thisLed = 0; thisLed < ledCount; thisLed++) {
      // if the array element's index is less than ledLevel,
      // turn the pin for this element on:
      if (thisLed < ledLevel) {
         digitalWrite(ledPins[thisLed], HIGH);
      }else { // turn off all pins higher than the ledLevel:
         digitalWrite(ledPins[thisLed], LOW);
      }
   }
}
No comments:
Post a Comment