
Debugging is an important part in any programming development. In
Apex, we do have certain tools to use for debugging. One of them is
system.debug() method which prints the value and output of variable in
debug logs.
There are two tools which you could you for debugging:
Example:
Consider our existing example of fetching the customer records which have been created today. We just want to know if the query is returning the results or not and if yes, then we would like to check the value of List.
Paste the below code in execute anonymous window and follow the steps which we have done for opening execute anonymous window.
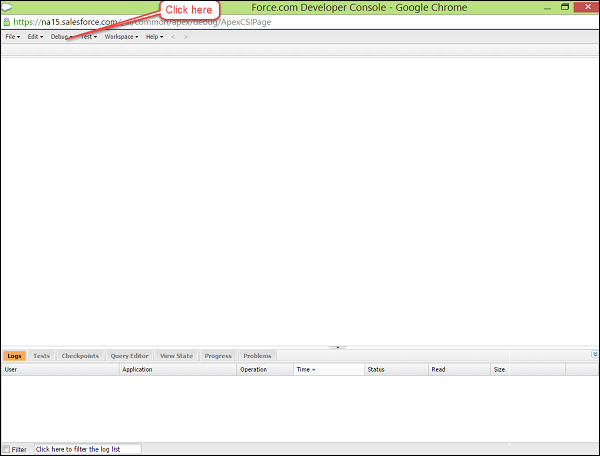
Step 1: Open Developer console
Step 2: Open execute anonymous from 'Debug' as shown below:
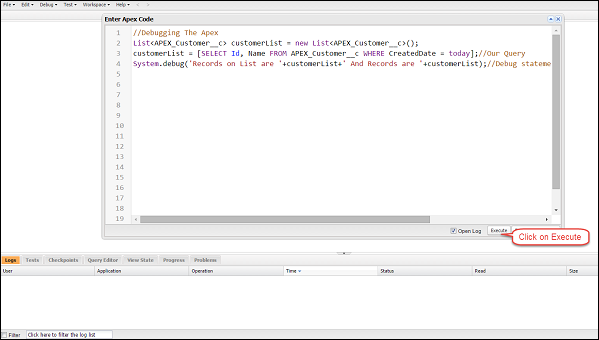
 Step 3: Open the Execute Anonymous window and paste the below code and click on execute.
 Enter 'USER' in filter condition as shown below
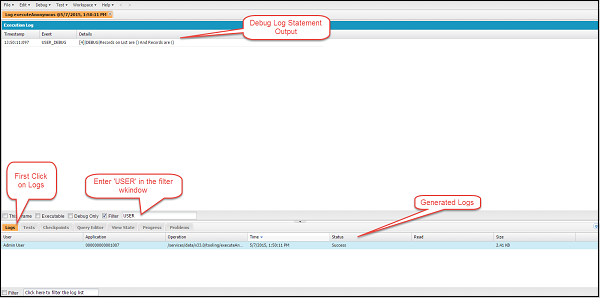 Step 5: Open the USER DEBUG Statement as shown below
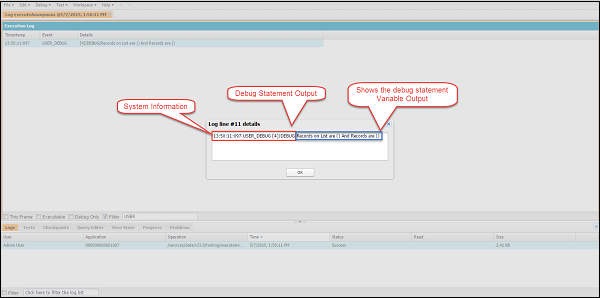 Step 6: Check for Error or variable values by which you could check and debug the code.
This is the Trigger Code which updates the Description field if the modified customer is active and you want to check the values of variables and records currently in scope:
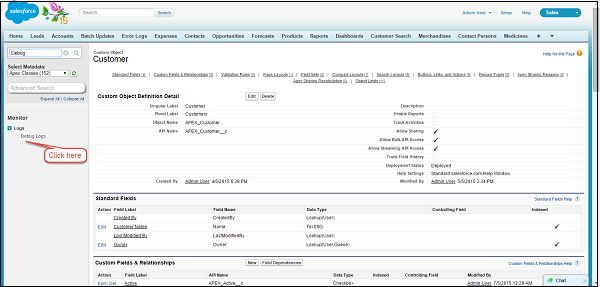
Step 1: Set the Debug logs for your user. Go to Setup and type 'Debug Log' in search setup window and then click on Link.
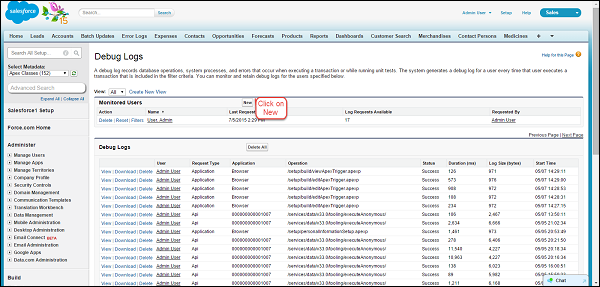
 Step 2: Set the debug logs as following:

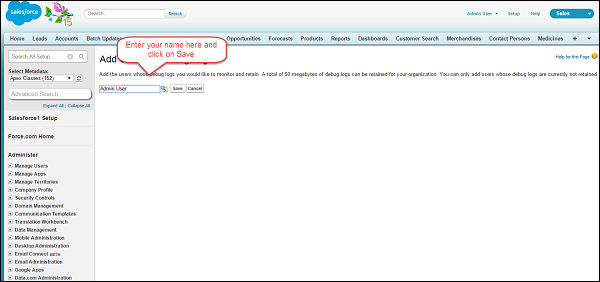
 Step 3: Enter the name of User for which you would like to setup. Enter your name.
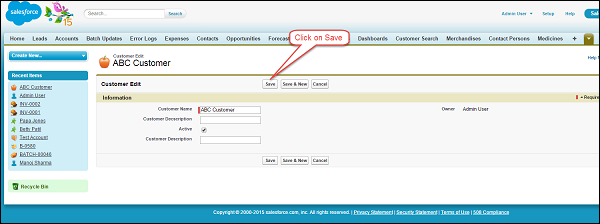
 Step 4: Modify the customer records as event should occur to generate the debug log.
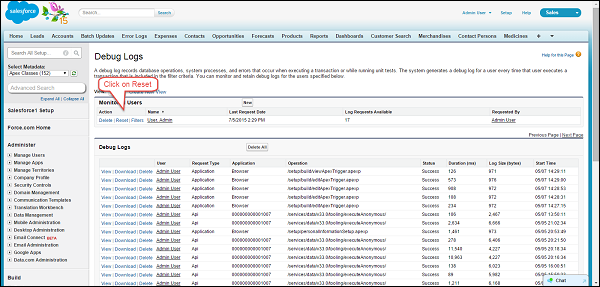
 Step 5: Now go to the debug logs section again. Open debug logs and click on Reset.
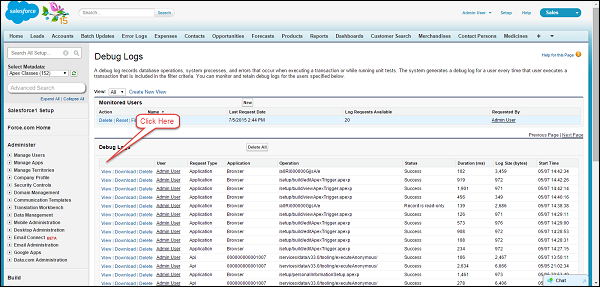
 Step 6: Click on the view link of the first debug log.
 Step 7: Search for the string 'USER' by using browser search as shown below:
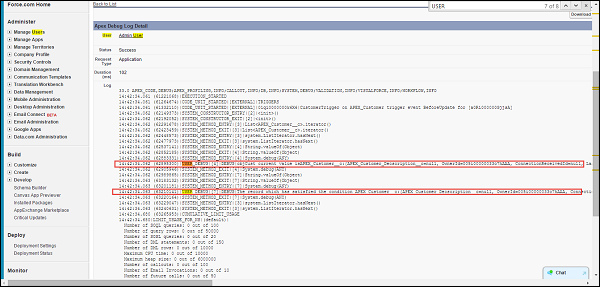 Debug statement is showing the value of the field at which we have set the point.
There are two tools which you could you for debugging:
- Developer Console
- Debug Logs
Debugging via Developer Console
You could use the Developer console and execute anonymous functionality for debugging the Apex as below:Example:
Consider our existing example of fetching the customer records which have been created today. We just want to know if the query is returning the results or not and if yes, then we would like to check the value of List.
Paste the below code in execute anonymous window and follow the steps which we have done for opening execute anonymous window.
Step 1: Open Developer console
Step 2: Open execute anonymous from 'Debug' as shown below:
Step 3: Open the Execute Anonymous window and paste the below code and click on execute.
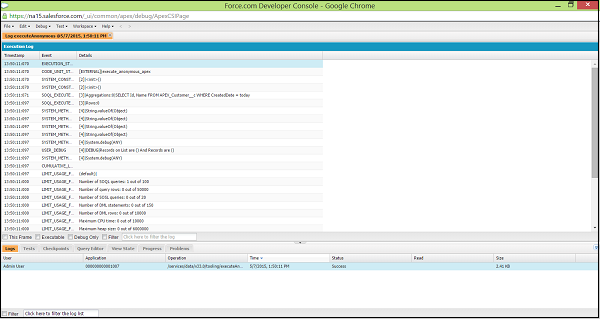
//Debugging The Apex
List<apex_customer__c> customerList = new List<apex_customer__c>();
customerList = [SELECT Id, Name FROM APEX_Customer__c WHERE CreatedDate = today];//Our Query
System.debug('Records on List are '+customerList+' And Records are '+customerList);//Debug statement to check the value of List and Size
Step 4: Open the Logs as shown below
Enter 'USER' in filter condition as shown below
Step 5: Open the USER DEBUG Statement as shown below
Step 6: Check for Error or variable values by which you could check and debug the code.
Debugging via Debug Logs
You could debug the same class via debug logs as well. Suppose, you have a trigger in Customer object and you would like to debug this Trigger for some variable values. Then you could do this via the debug logs as shown below:This is the Trigger Code which updates the Description field if the modified customer is active and you want to check the values of variables and records currently in scope:
trigger CustomerTrigger on APEX_Customer__c (before update) {
    List<apex_customer__c> customerList = new List<apex_customer__c>();
    for (APEX_Customer__c objCust: Trigger.new) {
        System.debug('objCust current value is'+objCust);
        if (objCust.APEX_Active__c == true) {
            objCust.APEX_Customer_Description__c = 'updated';
            System.debug('The record which has satisfied the condition '+objCust);
        }
    }
}
Perform following steps to generate the Debug logs.
Step 1: Set the Debug logs for your user. Go to Setup and type 'Debug Log' in search setup window and then click on Link.
Step 2: Set the debug logs as following:
Step 3: Enter the name of User for which you would like to setup. Enter your name.
Step 4: Modify the customer records as event should occur to generate the debug log.
Step 5: Now go to the debug logs section again. Open debug logs and click on Reset.
Step 6: Click on the view link of the first debug log.
Step 7: Search for the string 'USER' by using browser search as shown below:
Debug statement is showing the value of the field at which we have set the point.
No comments:
Post a Comment