
Do you have a blog? Do you have a static website? If yes, then you
need Google Analytics. This tool can do so many things. Even if you just
use it for the most basic of information, you can learn a lot about
your website visitors and traffic.
A quick glimpse at Google Analytics can tell you −
A quick glimpse at Google Analytics can tell you −
- How many people visit the website?
- Where do the visitors live?
- Is there a need for a mobile-friendly website?
- Which other websites send traffic to the website?
- Which marketing tactics drive the most traffic to the website?
- Which pages on the website are the most popular?
- How many visitors got converted into leads or customers?
- How to improve the website's speed?
- Which blog content the visitors like the most?
- Which place do the converting visitors belong to and what did they visit on the website?
Create a Google Analytics Account
First, you need to have a Google Analytics account. If you have a primary Google account that you use for other services like Gmail, Google Drive, Google Calendar, Google+, or YouTube, then you should set up your Google Analytics using that Google account. Otherwise, create a new one.- Once you have a Google account, you can go to Google Analytics by clicking the Sign into Google Analytics button.
- After you click the Sign Up button, you will need to fill out information for your website. You can have up to 100 Google Analytics accounts under one Google account.
- Once you’ve filled in the properties for your website, click the “Get Tracking ID” button. Agree to the terms and conditions and you will get a Google Analytics code. This must be installed on every page on your website. The installation will depend on what type of website you have.
- After you install your tracking code on the website, you will want to configure the Goals Setting. Goals will tell Google Analytics when something important has happened on your website.
- In Google Analytics, click the New Goal button. From there, you will choose the custom option or template options. You can create up to 20 goals on your website. Be sure that the ones you create are highly important to your business. This is the simplest of all conversion tracking in Google Analytics.
- If you want to add a new Google Analytics account, you can do so by going to your Admin menu, clicking the drop-down under the Account column, and clicking the Create New Account link. Once you've installed Google Analytics on your website(s), set up your goals, and wait about 24 hours for it to start getting data.
How to Use Google Analytics?
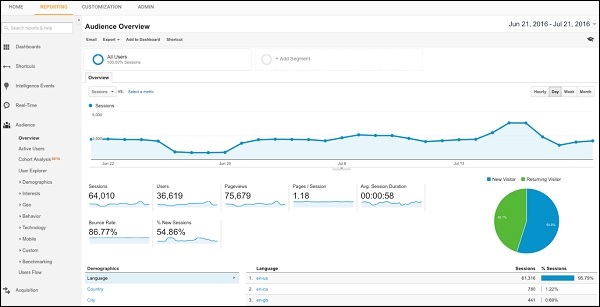
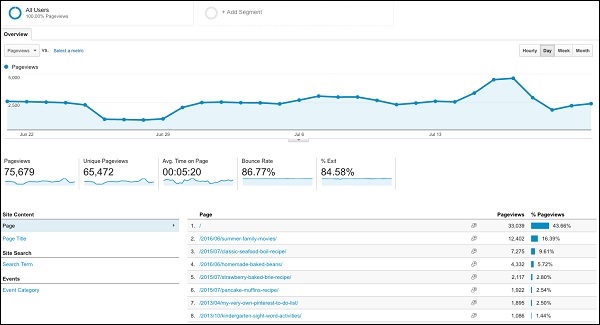
Each time you log in to Google Analytics, you will be taken to your Audience Overview report, from where you can access one of more than 50 reports available through Google Analytics.
- In the report at the top-right corner as shown in the above screenshot, you can click on the dates to change the date range of the data you are viewing.
- You can also check the Compare box to compare your data from one date range (such as this month) to a previous date range (such as the last month) to view your data.
- Beneath the main metrics, you will see reports that you can switch through to see the top ten languages, countries, cities, browsers, operating systems, service providers, and screen resolutions of the visitors.
Make Optimum Use of Google Analytics
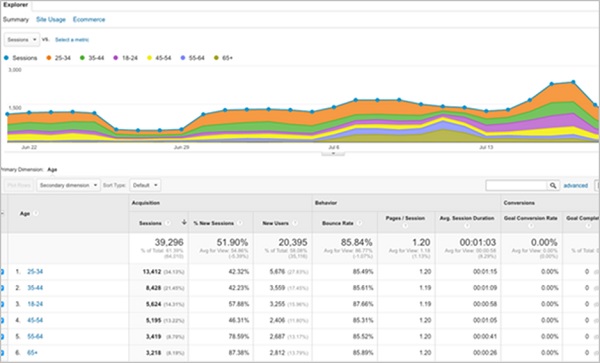
Using the endless tools available through Google Analytics, you can view various details. We have given here a few examples −Audience - Demographic – Age
You can use Google Analytics to find demographic details of the visitors to your site.
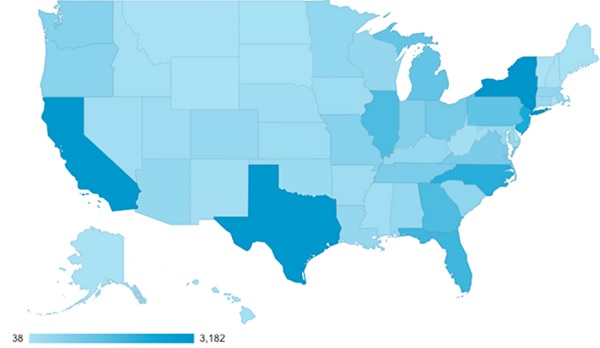
Audience - Geo – Location
You can find out where the traffic is coming from. It can either be global or local information.
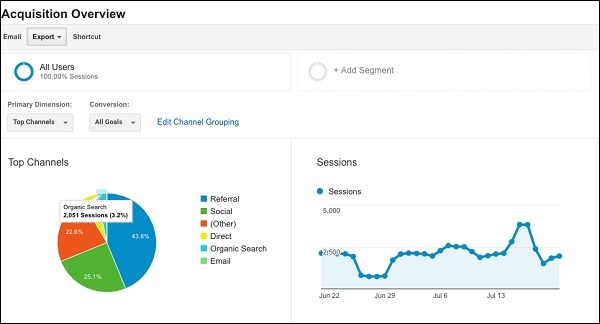
Acquisition Overview
You can determine which channels your traffic is coming from.
Behavior - Site Content
You can determine which pages on your website are being viewed the most.
Translating Insights into Action
Unfortunately, many firms find their digital marketing analytics programs fail to translate analytics into action. However, most of the times, translating insights into action involves manipulating your data for distinct insights. Some of them include −- Looking for relationships among your data. For instance, you might uncover a relationship between top performing posts and specific keywords used or publication timing.
- Looking at trends rather than data points. Trends often help you identify meaning in your data such as cyclical trends or when a particular data point stands out from others versus simply representing normal fluctuation.
- Turn data into predictive models. Don’t stop with viewing data as isolated points and basing forecasts on simple linear extrapolations. Predictive models use historical data to determine the relationship among a set of factors and desired outcomes (like KPIs).
- Predict future KPI performance. Analysts use algorithms to predict future KPI performance. You can even play “what-if” games to determine the impact on the performance of various actions. This helps determine which changes represent the greatest impact on performance.
No comments:
Post a Comment