
In this chapter, we will discuss how to create a Test Plan using
JMeter to monitor webservers. The uses of monitor tests are as follows −
 From the above screenshot, we can note a few things −
Enter 5000 milliseconds in the Thread Delay box. In general, using intervals shorter than 5 seconds may add stress to your server. Find out what is an acceptable interval before you deploy the monitor in your production environment.
 Note the graph has captions on both sides of the graph. On the left
is percent and the right is dead/healthy. If the memory line spikes up
and down rapidly, it could indicate memory thrashing. In those
situations, it is a good idea to profile the application with Borland
OptimizeIt or JProbe. What you want to see is a regular pattern for
load, memory and threads. Any erratic behavior usually indicates poor
performance or a bug of some sort.
Note the graph has captions on both sides of the graph. On the left
is percent and the right is dead/healthy. If the memory line spikes up
and down rapidly, it could indicate memory thrashing. In those
situations, it is a good idea to profile the application with Borland
OptimizeIt or JProbe. What you want to see is a regular pattern for
load, memory and threads. Any erratic behavior usually indicates poor
performance or a bug of some sort.
- Monitors are useful for a stress testing and system management.
- Used with stress testing, the monitor provides additional information about server performance.
- Monitors make it easier to see the relationship between server performance and response time on the client side.
- As a system administration tool, the monitor provides an easy way to monitor multiple servers from one console.
Setup Tomcat Server
We start with opening the Tomcat service status. To do this, edit the configuration file for users, <TOMCAT_HOME>/conf/tomcat-users.xml. This file contains a tomcat-users section (commented) as shown −<tomcat-users> <!-- <role rolename="tomcat"/> <role rolename="role1"/> <user username="tomcat" password="tomcat" roles="tomcat"/> <user username="both" password="tomcat" roles="tomcat,role1"/> <user username="role1" password="tomcat" roles="role1"/> --> </tomcat-users>We need to change this section to add the admin roles, manager, manager-gui and assign the user "admin". The revised file is as follows −
<tomcat-users>

   <role rolename="manager-gui"/>
   <role rolename="manager-script"/>
   <role rolename="manager-jmx"/>
   <role rolename="manager-status"/>
   <user username="admin" password="admin" roles="manager-gui,manager-script,manager-jmx,manager-status"/>

</tomcat-users>
Now start the tomcat server <TOMCAT_HOME>/bin/startup.sh for Linux and <TOMCAT_HOME>/bin/startup.bat for windows. Once started, check that the Tomcat supervision works by entering the following link in your browser −
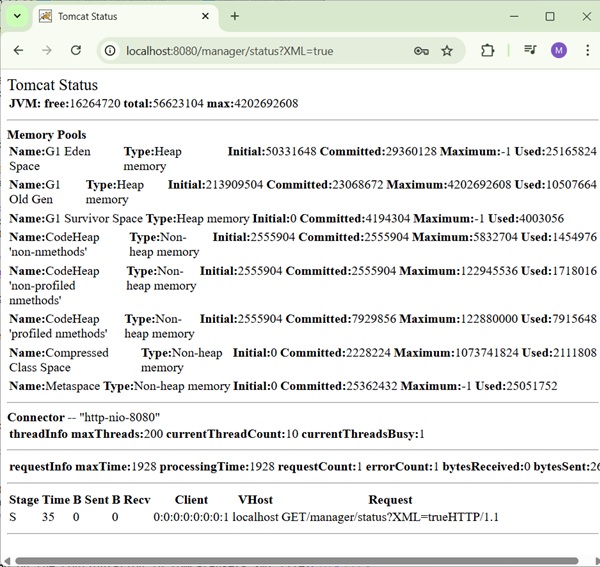
http://localhost:8080/manager/status?XML=trueAn authentication window appears in the browser. Enter the tomcat login and password associated (in our case it is admin). Then, the browser shows the execution status of Tomcat as below −
From the above screenshot, we can note a few things −- In the URL, note that XML = true (note the case sensitivity) allows a clean display of the supervisory Tomcat necessary for the JMeter functioning.
- Also note that there are default two connectors. The AJP connector used in general coupled with the mod_jk Apache HTTPD front module and the HTTP connector which is commonly used connector for direct access to Tomcat via port 8080.
Write JMeter Test Plan
Let us monitor the Tomcat server by writing a test plan −Rename Test Plan
- Open the JMeter window by clicking /home/manisha/apache-jmeter2.9/bin/jmeter.sh.
- Click the Test Plan node.
- Add a thread group as explained in the next step.
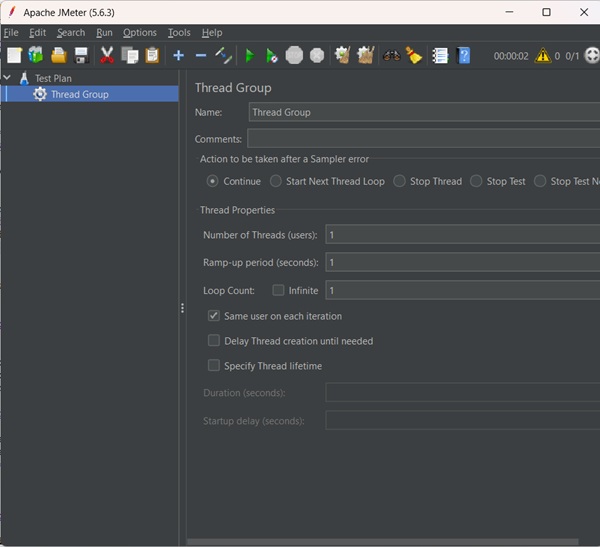
Add Thread Group
- Right-click on Test Plan > Add > Threads(Users) > Thread Group. Thread Group will get added under the Test Plan node.
- Change the loop count to forever (or some large number) so that enough samples are generated.
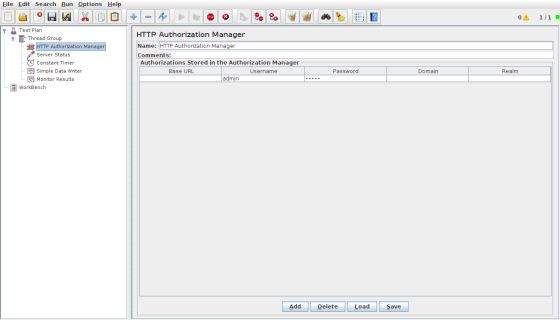
HTTP Authorization Manager
- Add HTTP Authorization Manager to the Thread Group element by selecting Add > Config element > HTTP Authorization Manager. This element manages authentication requested by the browser to see the Tomcat server status.
- Select the HTTP Authorization Manager.
- Edit the following details −
- Username − admin (depending on the configuration in tomcat-users.xml file)
- Password − admin (depending on the configuration in the tomcatusers.xml file)
- The other fields are left empty.
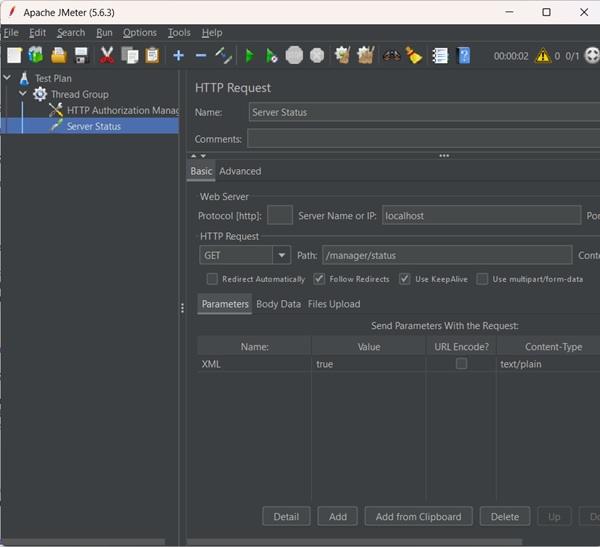
Add Sampler-HTTP Request
Now that we have defined our users, it is time to define the tasks that they will be performing. We add HTTP Request element.- Right click the mouse button to get the Add menu.
- Select Add > Sampler > HTTP Request.
- Then, select the HTTP Request element in the tree.
- Edit the following properties as in the image below −
- The following details are entered in this element −
- Name − Server Status
- Server Name or IP − localhost
- Port − 8080
- Path − /manager/status
- Parameters − Add a request parameter named "XML" in uppercase. Give it a value of "true" in lowercase.
- Optional Tasks − Check "Use as Monitor" at the bottom of the sampler.
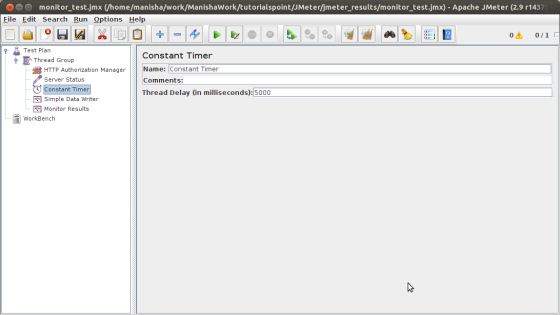
Add a Constant Timer
To request the status of the server periodically, add a Constant Timer which will allow a time interval between each request. Add a timer to this thread group by selecting Add > Timer > Constant Timer.Enter 5000 milliseconds in the Thread Delay box. In general, using intervals shorter than 5 seconds may add stress to your server. Find out what is an acceptable interval before you deploy the monitor in your production environment.
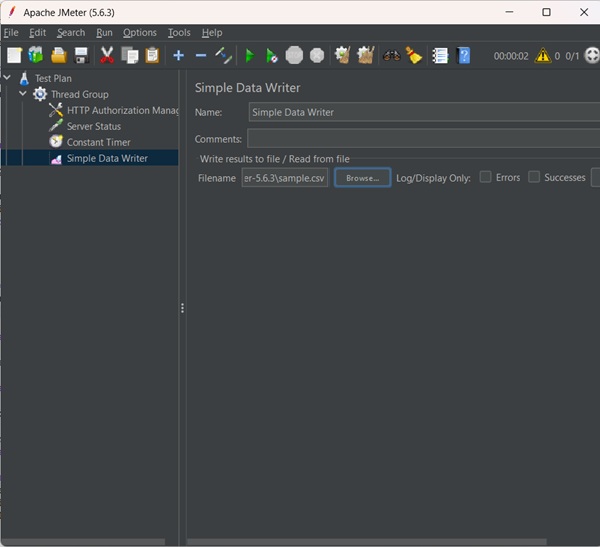
Add Listener
The final element you need to add to your Test Plan is a Listener. We add two types of listeners. One that stores results in a file and second that shows the graphical view of the results.- Select the thread group element.
- Add a Simple Data Writer listener Add > Listener > Simple Data Writer.
- Specify a directory and filename of the output file (in our case, it is /home/manisha/work/sample.csv)
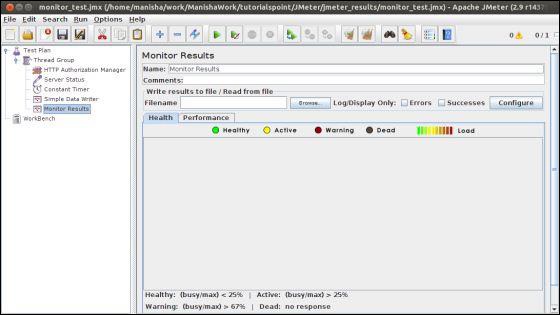
- Let us add another listener by selecting the test plan element Add > Listener > Monitor Results.
Run the Test Plan
Now save the above test plan as monitor_test.jmx. Execute this test plan using Run > Start option.View the Output
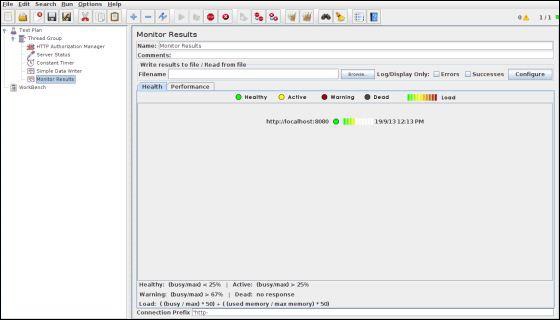
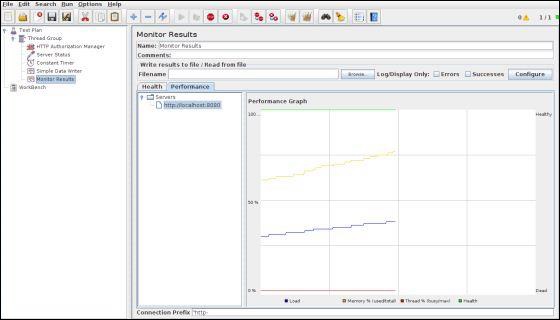
Results will be saved in /home/manisha/work/sample.csv file. You can also see a graphical result in the Monitor result listener as in the image below.
Note the graph has captions on both sides of the graph. On the left
is percent and the right is dead/healthy. If the memory line spikes up
and down rapidly, it could indicate memory thrashing. In those
situations, it is a good idea to profile the application with Borland
OptimizeIt or JProbe. What you want to see is a regular pattern for
load, memory and threads. Any erratic behavior usually indicates poor
performance or a bug of some sort.
No comments:
Post a Comment