This chapter demonstrates how you can use JFreeChart to create
Bubble Chart
from a given set of business data. A bubble chart displays information
in three-dimensional way. A bubble is plotted at the place where (x, y)
coordinate intersect. The size of the bubble is considered as range or
quantity of X and Y axis.
Business Data
Let us consider different persons along with their age, weight and
work capacities. The wok capacity can be treated as number of hours that
is plotted as bubbles in the chart.
|
WEIGHT
|
| AGE |
|
30 |
40 |
50 |
60 |
70 |
80 |
|
| 10 |
4 |
|
|
|
|
|
WORK |
| 20 |
|
5 |
|
|
|
|
| 30 |
|
|
10 |
|
|
|
| 40 |
|
|
|
8 |
|
|
| 50 |
|
|
|
|
9 |
|
| 60 |
|
|
|
|
|
6 |
AWT Based Application
Following is the code to create Bubble Chart from the above given
information. This code helps you embed a Bubble chart in any AWT based
application.
import java.awt.Color;
import java.awt.Dimension;
import javax.swing.JPanel;
import org.jfree.chart.*;
import org.jfree.chart.axis.NumberAxis;
import org.jfree.chart.plot.PlotOrientation;
import org.jfree.chart.plot.XYPlot;
import org.jfree.chart.renderer.xy.XYItemRenderer;
import org.jfree.data.xy.DefaultXYZDataset;
import org.jfree.data.xy.XYZDataset;
import org.jfree.ui.ApplicationFrame;
import org.jfree.ui.RefineryUtilities;

public class BubbleChart_AWT extends ApplicationFrame
{
   public BubbleChart_AWT( String s )
   {
      super( s );
      JPanel jpanel = createDemoPanel( );
      jpanel.setPreferredSize(new Dimension( 560 , 370 ) );
      setContentPane( jpanel );
   }

   private static JFreeChart createChart( XYZDataset xyzdataset )
   {
      JFreeChart jfreechart = ChartFactory.createBubbleChart(
         "AGE vs WEIGHT vs WORK",
         "Weight",
         "AGE",
         xyzdataset,
         PlotOrientation.HORIZONTAL,
         true, true, false);

      XYPlot xyplot = ( XYPlot )jfreechart.getPlot( );
      xyplot.setForegroundAlpha( 0.65F );
      XYItemRenderer xyitemrenderer = xyplot.getRenderer( );
      xyitemrenderer.setSeriesPaint( 0 , Color.blue );
      NumberAxis numberaxis = ( NumberAxis )xyplot.getDomainAxis( );
      numberaxis.setLowerMargin( 0.2 );
      numberaxis.setUpperMargin( 0.5 );
      NumberAxis numberaxis1 = ( NumberAxis )xyplot.getRangeAxis( );
      numberaxis1.setLowerMargin( 0.8 );
      numberaxis1.setUpperMargin( 0.9 );

      return jfreechart;
   }

   public static XYZDataset createDataset( )
   {
      DefaultXYZDataset defaultxyzdataset = new DefaultXYZDataset();

      double ad[ ] = { 30 , 40 , 50 , 60 , 70 , 80 };
      double ad1[ ] = { 10 , 20 , 30 , 40 , 50 , 60 };
      double ad2[ ] = { 4 , 5 , 10 , 8 , 9 , 6 };
      double ad3[][] = { ad , ad1 , ad2 };
      defaultxyzdataset.addSeries( "Series 1" , ad3 );

      return defaultxyzdataset;
   }

   public static JPanel createDemoPanel( )
   {
      JFreeChart jfreechart = createChart( createDataset( ) );
      ChartPanel chartpanel = new ChartPanel( jfreechart );

      chartpanel.setDomainZoomable( true );
      chartpanel.setRangeZoomable( true );

      return chartpanel;
   }

   public static void main( String args[ ] )
   {
      BubbleChart_AWT bubblechart = new BubbleChart_AWT( "Bubble Chart_frame" );

      bubblechart.pack( );
      RefineryUtilities.centerFrameOnScreen( bubblechart );
      bubblechart.setVisible( true );
   }
}
Let us keep the above Java code in
BubbleChart_AWT.java file, and then compile and run it from command prompt as follows :
$javac BubbleChart_AWT.java
$java BubbleChart_AW
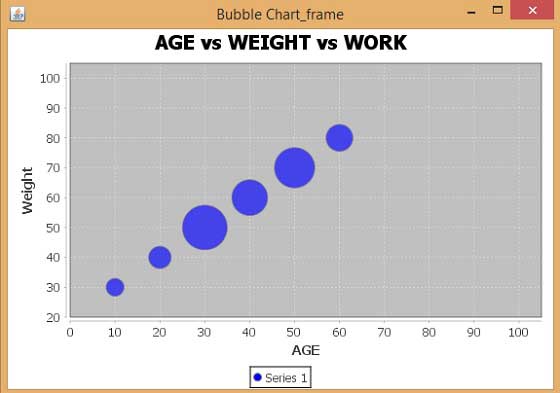
If everything is fine , it will compile and run to generate the following Bubble Graph :
JPEG Image Creation
Let us re-write above example to generate a JPEG image from command line.
import java.io.*;
import java.awt.Color;
import org.jfree.chart.*;
import org.jfree.chart.axis.NumberAxis;
import org.jfree.chart.plot.PlotOrientation;
import org.jfree.chart.plot.XYPlot;
import org.jfree.chart.renderer.xy.XYItemRenderer;
import org.jfree.data.xy.DefaultXYZDataset;
import org.jfree.chart.ChartUtilities;

public class BubbleChart_image
{
   public static void main( String args[ ] )throws Exception
   {
      DefaultXYZDataset defaultxyzdataset = new DefaultXYZDataset( );
      double ad[ ] = { 30 , 40 , 50 , 60 , 70 , 80 };
      double ad1[ ] = { 10 , 20 , 30 , 40 , 50 , 60 };
      double ad2[ ] = { 4 , 5 , 10 , 8 , 9 , 6 };
      double ad3[ ][ ] = { ad , ad1 , ad2 };
      defaultxyzdataset.addSeries( "Series 1" , ad3 );

      JFreeChart jfreechart = ChartFactory.createBubbleChart(
         "AGE vs WEIGHT vs WORK",
         "Weight",
         "AGE",
         defaultxyzdataset,
         PlotOrientation.HORIZONTAL,
         true, true, false);

      XYPlot xyplot = ( XYPlot )jfreechart.getPlot( );
      xyplot.setForegroundAlpha( 0.65F );
      XYItemRenderer xyitemrenderer = xyplot.getRenderer( );
      xyitemrenderer.setSeriesPaint( 0 , Color.blue );
      NumberAxis numberaxis = ( NumberAxis )xyplot.getDomainAxis( );
      numberaxis.setLowerMargin( 0.2 );
      numberaxis.setUpperMargin( 0.5 );
      NumberAxis numberaxis1 = ( NumberAxis )xyplot.getRangeAxis( );
      numberaxis1.setLowerMargin( 0.8 );
      numberaxis1.setUpperMargin( 0.9 );

      int width = 560; /* Width of the image */
      int height = 370; /* Height of the image */
      File bubbleChart = new File("BubbleChart.jpeg");
      ChartUtilities.saveChartAsJPEG(bubbleChart,jfreechart,width,height);
   }
}
Let us keep the above Java code in
BubbleChart_image.java file, and then compile and run it from command prompt as follows:
$javac BubbleChart_image.java
$java BubbleChart_image
If everything is fine , it will compile and run to create JPEG image file named
BubbleChart.jpeg in your current directory.

No comments:
Post a Comment