In a pie chart, the arc length of each sector is proportional to the
quantity it represents. This chapter demonstrates how we can use
JFreeChart to create
Pie Chart from a given set of business data.
Business data
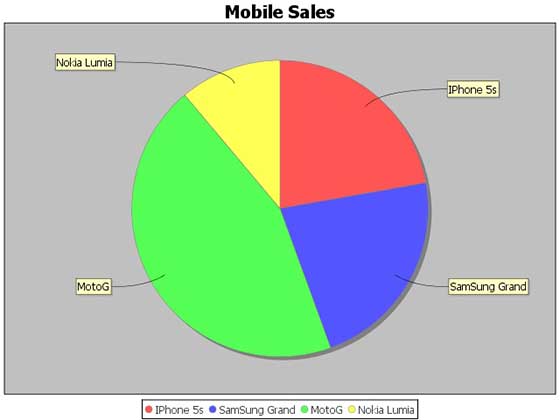
The following example depicts mobile sale with the help of a pie
chart. Following is a list of different mobile brands and their sale
(units per day).
| S.N. |
Mobile Brands |
Sales (UNITS per day) |
| 1 |
Iphone 5S |
20 |
| 2 |
Samsung Grand |
20 |
| 3 |
MOTO G |
40 |
| 4 |
Nokia Lumia |
10 |
AWT Based Application
Following is the code to create Pie Chart from the above given
information. This code helps you embed a pie chart in any AWT based
application.
import javax.swing.JPanel;
import org.jfree.chart.ChartFactory;
import org.jfree.chart.ChartPanel;
import org.jfree.chart.JFreeChart;
import org.jfree.data.general.DefaultPieDataset;
import org.jfree.data.general.PieDataset;
import org.jfree.ui.ApplicationFrame;
import org.jfree.ui.RefineryUtilities;

public class PieChart_AWT extends ApplicationFrame
{
   public PieChart_AWT( String title )
   {
      super( title );
      setContentPane(createDemoPanel( ));
   }
   private static PieDataset createDataset( )
   {
      DefaultPieDataset dataset = new DefaultPieDataset( );
      dataset.setValue( "IPhone 5s" , new Double( 20 ) );
      dataset.setValue( "SamSung Grand" , new Double( 20 ) );
      dataset.setValue( "MotoG" , new Double( 40 ) );
      dataset.setValue( "Nokia Lumia" , new Double( 10 ) );
      return dataset;
   }
   private static JFreeChart createChart( PieDataset dataset )
   {
      JFreeChart chart = ChartFactory.createPieChart(
         "Mobile Sales",  // chart title
         dataset,        // data
         true,           // include legend
         true,
         false);

      return chart;
   }
   public static JPanel createDemoPanel( )
   {
      JFreeChart chart = createChart(createDataset( ) );
      return new ChartPanel( chart );
   }
   public static void main( String[ ] args )
   {
      PieChart_AWT demo = new PieChart_AWT( "Mobile Sales" );
      demo.setSize( 560 , 367 );
      RefineryUtilities.centerFrameOnScreen( demo );
      demo.setVisible( true );
   }
}
Let us keep above Java code in
PieChart_AWT.java file, and then compile and run it from command prompt as follows :
$javac PieChart_AWT.java
$java PieChart_AWT
If everything is fine , it will compile and run to generate the following Pie Graph :
If you do not need to embed your chart in any application then you
can create chart images at command prompt. JFreeChart allows you to
save chart images in either JPG or PNG formats.
JPEG Image Creation
Let us re-write above example to generate a JPEG image from command
line. Following are two APIs provided by JFreeChart library, which you
can use to generate either PNG or JPEG image as per your requirement.
- saveChartAsPNG() - API to save image in PNG format.
- saveChartAsJPEG() - API to save image in JPEG format.
import java.io.*;
import org.jfree.chart.ChartUtilities;
import org.jfree.chart.ChartFactory;
import org.jfree.chart.JFreeChart;
import org.jfree.data.general.DefaultPieDataset;

public class PieChart {
   public static void main( String[ ] args ) throws Exception
   {

      DefaultPieDataset dataset = new DefaultPieDataset( );
      dataset.setValue("IPhone 5s", new Double( 20 ) );
      dataset.setValue("SamSung Grand", new Double( 20 ) );
      dataset.setValue("MotoG", new Double( 40 ) );
      dataset.setValue("Nokia Lumia", new Double( 10 ) );

      JFreeChart chart = ChartFactory.createPieChart(
         "Mobile Sales", // chart title
         dataset, // data
         true, // include legend
         true,
         false);

      int width = 640; /* Width of the image */
      int height = 480; /* Height of the image */
      File pieChart = new File( "PieChart.jpeg" );
      ChartUtilities.saveChartAsJPEG( pieChart , chart , width , height );
   }
}
Let us keep the above Java code in
PieChart.java file, and then compile and run it from command prompt as follows :
$javac PieChart.java
$java PieChart
If everything is fine , it will compile and run to create JPEG image file named
PieChart.jpeg in your current directory.

No comments:
Post a Comment