
Debugging a Java Program
The quickest way to debug a Java program is to using the Package Explorer view. In the Package Explorer view −- Right click on the java class that contains the main method.
- Select Debug As → Java Application.
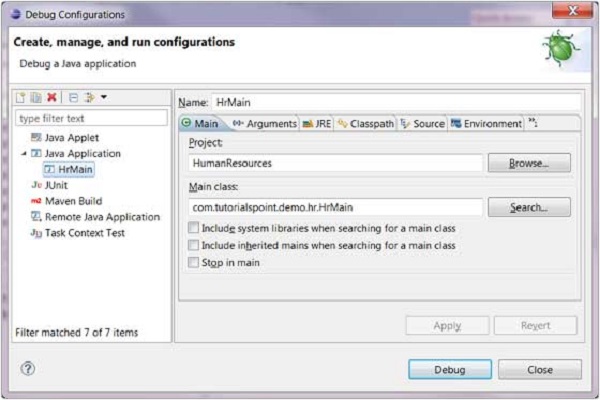
Either actions mentioned above create a new Debug Configuration and use it to start the Java application.
If a Debug configuration has already been created you can use it to start the Java application by selecting Debug Configurations from the Run menu, clicking on the name of the debug configuration and then clicking on the Debug button.
 The Debug menu item on the Run menu can be used to restart the java application that was previously started in the debug mode.
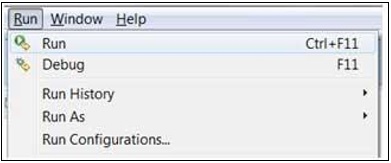 The shortcut key to launch the previously launched Java application
in the debug mode is F11. When a java program is started in the debug
mode, users are prompted to switch to the debug perspective. The debug
perspective offers additional views that can be used to troubleshoot an
application.
The shortcut key to launch the previously launched Java application
in the debug mode is F11. When a java program is started in the debug
mode, users are prompted to switch to the debug perspective. The debug
perspective offers additional views that can be used to troubleshoot an
application.The java editor allows users to place break points in the java code. To set a break point, in the editor area right click on the marker bar and select Toggle Breakpoint.
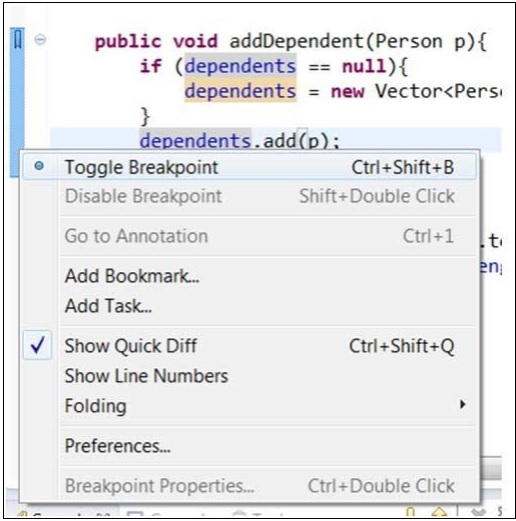 Breakpoints are shown on the marker bar. They are also visible in the Breakpoints View.
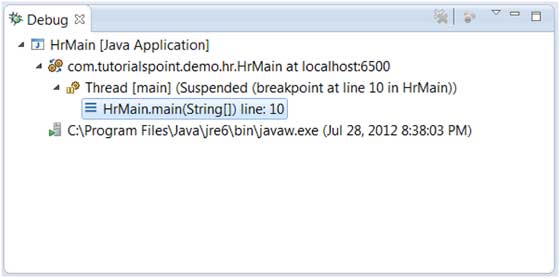
When the execution of code reaches a break point the JVM suspends the execution of the program. At this point, you can inspect the memory and execute the program in a controlled manner.
When the execution of a program is paused, the debug view can be used to inspect the call stack.
 The variables view can be used to inspect the value of variables.
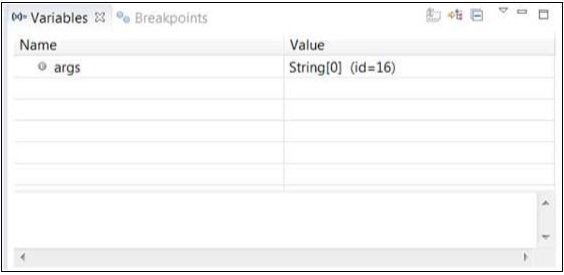 The run menu has menu items that allow you to Resume execution, step over a line of code, step into a function etc.
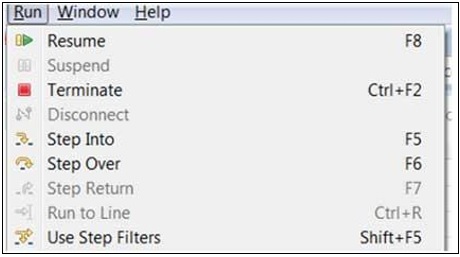 The picture given above shows the shortcut keys associated with actions such as Resume, Step Into and Step Over, etc.
No comments:
Post a Comment